The Fictions of Mean Reversion
Updated October 2026: Use py-glm for the model fitting and inference, add the section on change-in-slope parameterization, and briefly discuss more realistic error models.
Danger always stalks the data analyst: whereas a software engineer’s code may fail to compile or pass unit tests, the data analyst’s work is silent about its incorrectness. It’s rare for the conclusions of an analysis of observational data to be directly falsifiable. This post is about a data analytic error that I’ve encountered a few times in my career.
Penance: The error model used in this post is unnatural. For the bothered readers, I’ll return to note a more realistic error model at the end.
Setup
Imagine a world with two nations:
- The Tourmekian Empire, with its currency ₮.
- The Valley of the Wind, with its currency ₩.
The nations exist in peaceful times, long after the forests have subsided and the earth cleansed of the residual toxins of war. The world has healthy culture of travel and trade.
We are employed as a data analyst at a currency trading firm, our job is to support Tourmekians seeking to purchase ₩ with ₮, and Valleyers seeking to purchase ₮ with ₩. We look at plots like this, the exchange rate from ₮ to ₩, all days of our working life 1:
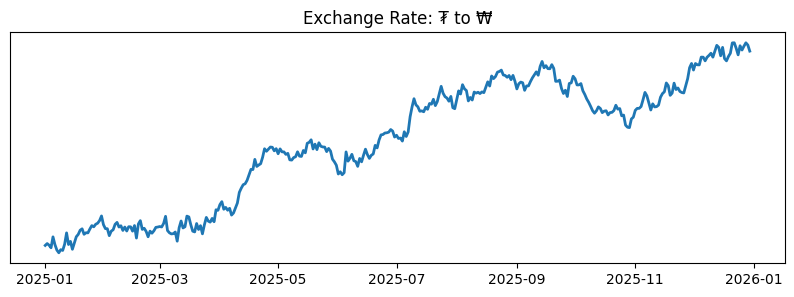
At some point, a curiosity strikes us: possibly some of our customers are residents of Tourmekia, but are native to the Valley of the Wind. It’s likely some of these are using our service to exchange their Tourmekian salaries for the Valley’s ₩, with the intention of using that ₩ whenever they return to the homeland. These customers likely have no need to immediately make this exchange as soon as they are paid in ₮, but instead will wait for favorable moments. We hypothesize: it’s likely that exchange rate increases should associate with more usage of our service, and vice versa.
Being a responsible business that would never, ever cut corners on data engineering, we have historical data on daily transaction volumes:
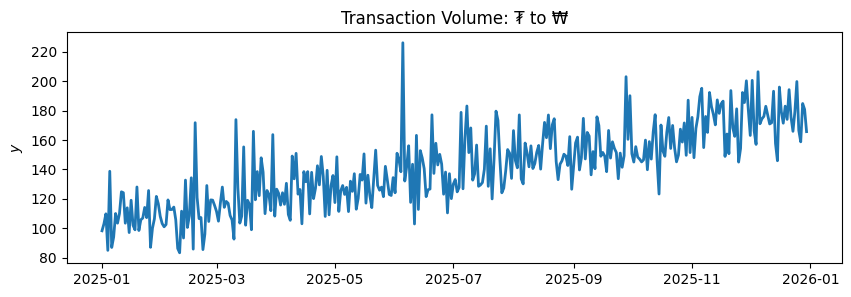
We can inspect our hypothesis by scattering the day-over-day change in transaction volume against the change in exchange rate. There is a clear association:
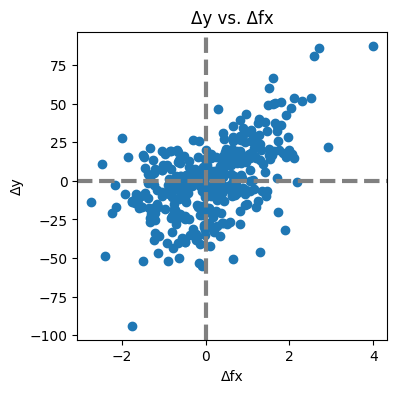
We can validate this non-visually, the mean change in volume is positive when the exchange rate increases, and negative when it decreases. Demand goes up and down in synchronization with the exchange rate. The effect is symmetric, or close enough to believe that it is:
up = df["y"].diff()[df["Δfx"] > 0].mean()
print(f"mean(Δy) where Δfx > 0: {up:2.2f}")
# mean(Δy) where Δfx > 0: 8.99

down = df["y"].diff()[df["Δfx"] < 0].mean()
print(f"mean(Δy) where Δfx < 0: {down:2.2f}")
# mean(Δy) where Δfx < 0: -8.92
This is a nice result! Our curiosity has been rewarded, and we’ve made a useful discovery about our customer dynamics. We’re wrong.
自分の 罪深さに おののきます
The Two Worlds
Here is a different simulation of the transaction volume series:
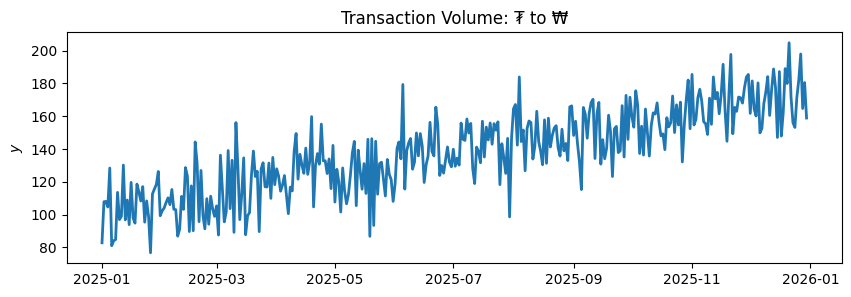
This series looks structurally identical to the previous one to the untrained eye, any observer would be forgiven if they blamed the slight differences on noise. In support, the summary statistics of this new series are very similar to the previous one:
up = df["y_new"].diff()[df["Δfx"] > 0].mean()
print(f"mean(Δy) where Δfx > 0: {up:2.2f}")
# mean(Δy) where Δfx > 0: 8.88

down = df["y_new"].diff()[df["Δfx"] < 0].mean()
print(f"mean(Δy) where Δfx < 0: {down:2.2f}")
# mean(Δy) where Δfx < 0: -8.82
These two transaction processes are not the same, and sample from very different dynamics of customer behaviour. If we scatterplot side by side, maybe the observant and lucky among us will start to sense something is up2:
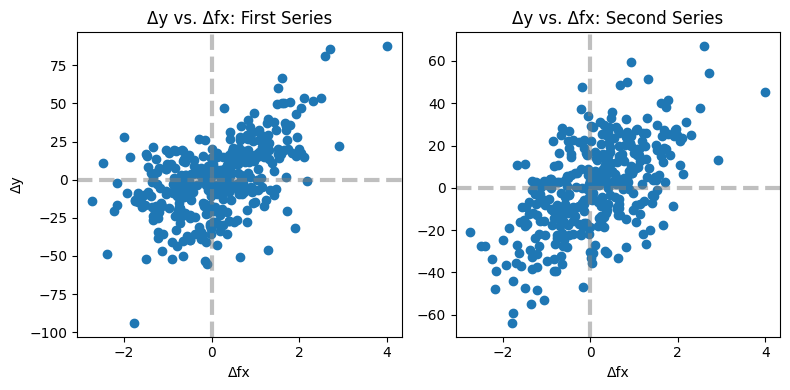
We generated data according to the following random processes:
First series, asymmetric Δfx effect:
Second series, symmetric Δfx effect:
In the first scenario, the effect is not symmetric, while in the second it is symmetric. Customers in the first scenario do increase their transaction rate when the exchange rate moves favorably, but do not decrease their transaction rate when it moves against their favor.
This is much easier to see if we plot the true trendline (i.e. the $a + b t$ part of the above equations) along with our observed data series:
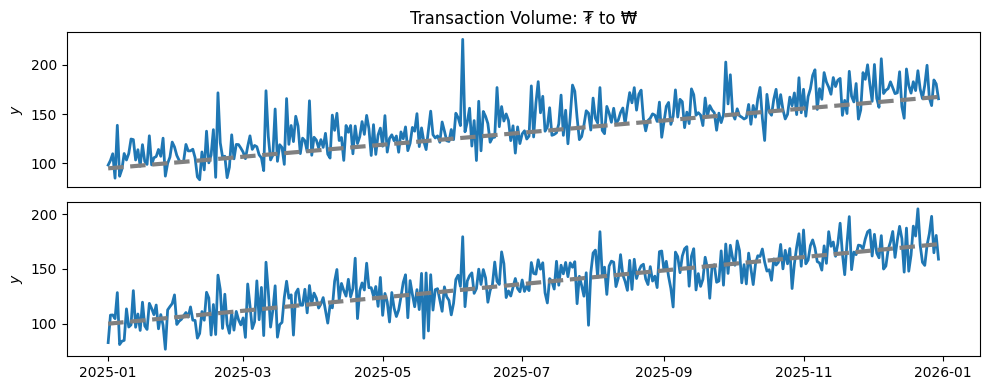
In the first series, the observed transaction volume mostly stays above the true trendline, any dips below are due to the noise term $\epsilon$. The second series moves around the trendline symmetrically. Of course, this is not an effective test of which one we have, nature never lets us see the true trend line, it’s only available in our fictional worlds.
So why, in the first case of only upwards effects, does our naïve data analysis detect an association? It’s due to mean reversion: when the exchange rate decreases customer behaviour reverts to its baseline state of a random perturbation around the true trendline. When such an observation follows one where the exchange rate moved upwards (which happens about half the time) this results in (most likely) a downwards move from its elevated state back towards the trendline. So, on average, a fall in exchange rate is simultaneous with a fall in transaction rate.
Capturing the True Effect
Asymmetric effects are common in practice, and are worth considering whenever analysing a response to some stimuli that may be positive or negative.
The basic technique is to specify a regression model including hinge transformations of $\Delta \fx$:
If we fit this model:
r = GLM(family=Gaussian()).fit(
    df,
    formula="y_asymm ~ t + np.maximum(Δfx, 0) + np.minimum(Δfx, 0)"
)
r.summary_frame(level=0.95).round(2)
| estimate | std error | lower 95% | upper 95% | |
|---|---|---|---|---|
| Intercept | 94.93 | 1.28 | 92.41 | 97.46 |
| t | 0.20 | 0.01 | 0.19 | 0.21 |
| np.maximum(Δfx, 0) | 19.87 | 1.04 | 17.83 | 21.92 |
| np.minimum(Δfx, 0) | -0.59 | 1.09 | -2.73 | 1.54 |
We infer correct coefficient estimates from the observed data. In particular, the confidence interval for the np.minimum(Δfx, 0) predictor contains zero, so we correctly deduce that there is no detectable effect of downwards movements in $\Delta \fx$.
If instead we fit the wrong model:
We infer a symmetric effect of half the size:
r = GLM(family=Gaussian()).fit(
    df,
    formula="y_asymm ~ t + Δfx"
)
r.summary_frame(level=0.95).round(2)
| estimate | std error | lower 95% | upper 95% | |
|---|---|---|---|---|
| Intercept | 102.75 | 1.25 | 100.30 | 105.19 |
| t | 0.20 | 0.01 | 0.19 | 0.21 |
| Δfx | 9.93 | 0.62 | 8.72 | 11.15 |
Insidiously, with the wrong model we draw two incorrect conclusions: we infer half of the correct positive effect, and a negative effect when there is none.
The Change-In-Slope Parameterization
Consider what happens when we fit the hinge transformation model to the data with a symmetric effect:
r = GLM(family=Gaussian()).fit(
    df,
    formula="y_symm ~ t + np.maximum(Δfx, 0) + np.minimum(Δfx, 0)"
)
r.summary_frame(level=0.95).round(2)
| estimate | std error | lower 95% | upper 95% | |
|---|---|---|---|---|
| Intercept | 97.57 | 1.24 | 95.13 | 100.01 |
| t | 0.21 | 0.00 | 0.20 | 0.22 |
| np.maximum(Δfx, 0) | 10.70 | 1.00 | 8.72 | 12.68 |
| np.minimum(Δfx, 0) | 8.48 | 1.05 | 6.42 | 10.55 |
Now, we know that the true coefficients for np.maximum(Δfx, 0) and np.minimum(Δfx, 0) are equal, since the correct specification has only a Δfx term. But there’s no way to test this from the output table; the two estimates are correlated (because the transformed predictors are) so we would need their covariance to construct a valid test. This can be done, but there’s a more transparent way.
What we want is for the change in slope at zero to appear in our model. There’s a nice trick to do this, we use the change-in-slope parameterization:
r = GLM(family=Gaussian()).fit(
    df,
    formula="y_symm ~ t + Δfx + np.maximum(Δfx, 0)"
)
r.summary_frame(level=0.95).round(2)
In this specification, the coefficient of np.maximum(Δfx, 0) is exactly the change in slope, because:
where $\beta_+ - \beta_-$ is the change in slope and we’ve made use of the handy identity $\min(x, 0) = x - \max(x, 0)$.
Here are the coefficient estimates:
| estimate | std error | lower 95% | upper 95% | |
|---|---|---|---|---|
| Intercept | 97.57 | 1.24 | 95.13 | 100.01 |
| t | 0.21 | 0.00 | 0.20 | 0.22 |
| Δfx | 8.48 | 1.05 | 6.42 | 10.55 |
| np.maximum(Δfx, 0) | 2.22 | 1.78 | -1.28 | 5.71 |
As we expect, the change in slope is indistinguishable from zero on the symmetric data.
On the other hand, on the asymmetric effect data:
r = GLM(family=Gaussian()).fit(
    df,
    formula="y_asymm ~ t + Δfx + np.maximum(Δfx, 0)"
)
r.summary_frame(level=0.95).round(2)
| estimate | std error | lower 95% | upper 95% | |
|---|---|---|---|---|
| Intercept | 94.93 | 1.28 | 92.41 | 97.46 |
| t | 0.20 | 0.01 | 0.19 | 0.21 |
| Δfx | -0.59 | 1.09 | -2.73 | 1.54 |
| np.maximum(Δfx, 0) | 20.46 | 1.84 | 16.85 | 24.08 |
Everything checks out again, there’s no effect when $\Delta \fx < 0$, but it jumps to an effect size of $20$ once $\Delta \fx$ passes zero.
The Error Model
We’ve assumed the error $\epsilon$ is i.i.d. Gaussian throughout. The Gaussian bit is a reasonable enough assumption, but independence is not so much. In natural data of this sort, the errors are autocorrelated. Our assumption will tend to result in confidence intervals that are too narrow: we’re assuming the data is more informative than it really is.
自分の 罪深さに おののきます
A more careful analysis would specify a dependence structure on the error term (an AR structure of some sort maybe), or use a non-parametric tool like the block bootstrap to estimate the standard errors.
The independence assumption serves our purpose of illustration well enough, but a good analysis of nature’s data will do better.